View Incidents
Click the Incidents tab to open the list of incidents in your region. Use the Showing filter Search criteria that allow you to pinpoint the clients and details you need. to only show incidents that are Active, Pending, or Complete. The list provides details about the incidents, including the incident Name, Type, Start and End Times, Status, and Last Update.
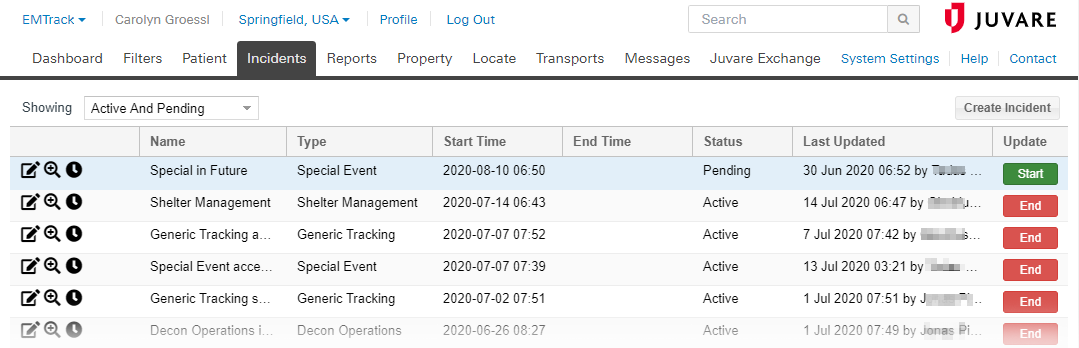
Important features
|
Feature |
Description |
|---|---|
|
Showing |
Filter the list by selecting an option to view Active, Pending, and/or Complete incidents. |
|
Sorting |
Click a column header to sort the list of incidents by items in that column. Click it again to reverse the sort order. |
|
Edit |
Click to edit the incident's detail. |
|
View |
Click to view the incident's detail. This view is read only. |
|
History |
Click to view the history of changes to the incident. |
|
Start |
Update column; click to start an incident. |
|
Reopen |
Update column; click to reopen an incident. |
|
End |
Update column; click to end the incident. |
Incident Details
You can view information about incidents, including details about the incident location, sub-locations, and provider access.
To view an incident
-
Click the Incidents tab.
-
In the Showing list, identify the status of incidents you want to see by clicking Active and Pending, Active, Pending, Complete, or All.
-
In the list, locate the incident and click its view icon. The incident details window opens with the General Information tab active.
-
Click the General Information, Incident Sites, or Providers tab to view those details.
View Incident History
Your EMTrack system records changes to an incident's details, such as noting the user who added an incident site or changed the incident's description or providers. You can view this history, which also shows the user who started and, if appropriate, ended the incident.
To view history
-
Click the Incidents tab.
-
Select the appropriate option from Showing.
-
Locate the incident and click its history icon. The history window opens.
Related Concepts