
The Crisis Track board integrates field-collected data from Crisis Track into WebEOC Nexus, allowing emergency managers to view and analyze damage assessments in real time. It provides visibility into assessment locations, severity levels, and summary statistics that support response, recovery, and disaster declaration processes.
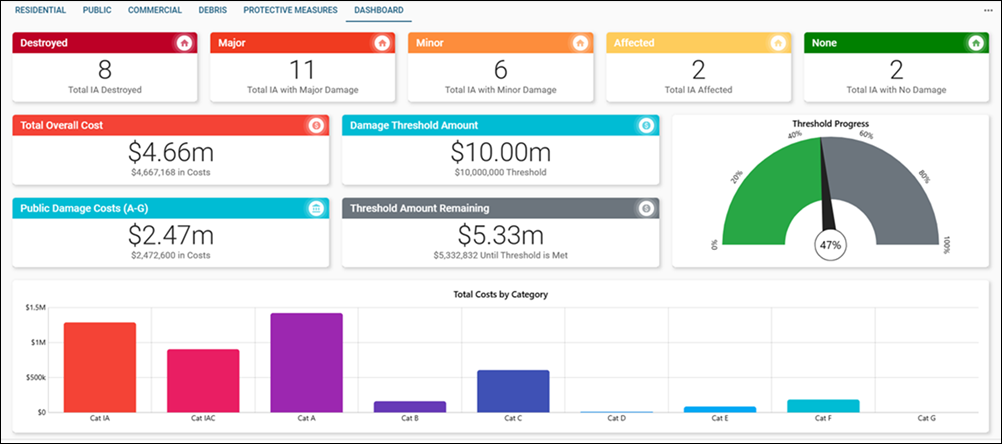
The Crisis Track board consists of several tabs - Residential, Public, Commercial, Debris, Protective Measures, and the Dashboard - that allow you to visualize assessment locations on a map, analyze assessment data, open assessments for a review of the details, and view a summary statistics of the data.
For more details about this board, watch the Crisis Track Integration Training Video .
Your Juvare product login does not grant access to the Juvare Training Center. To view the training video, please create a separate account on the Juvare Training Center site.
Key Capabilities
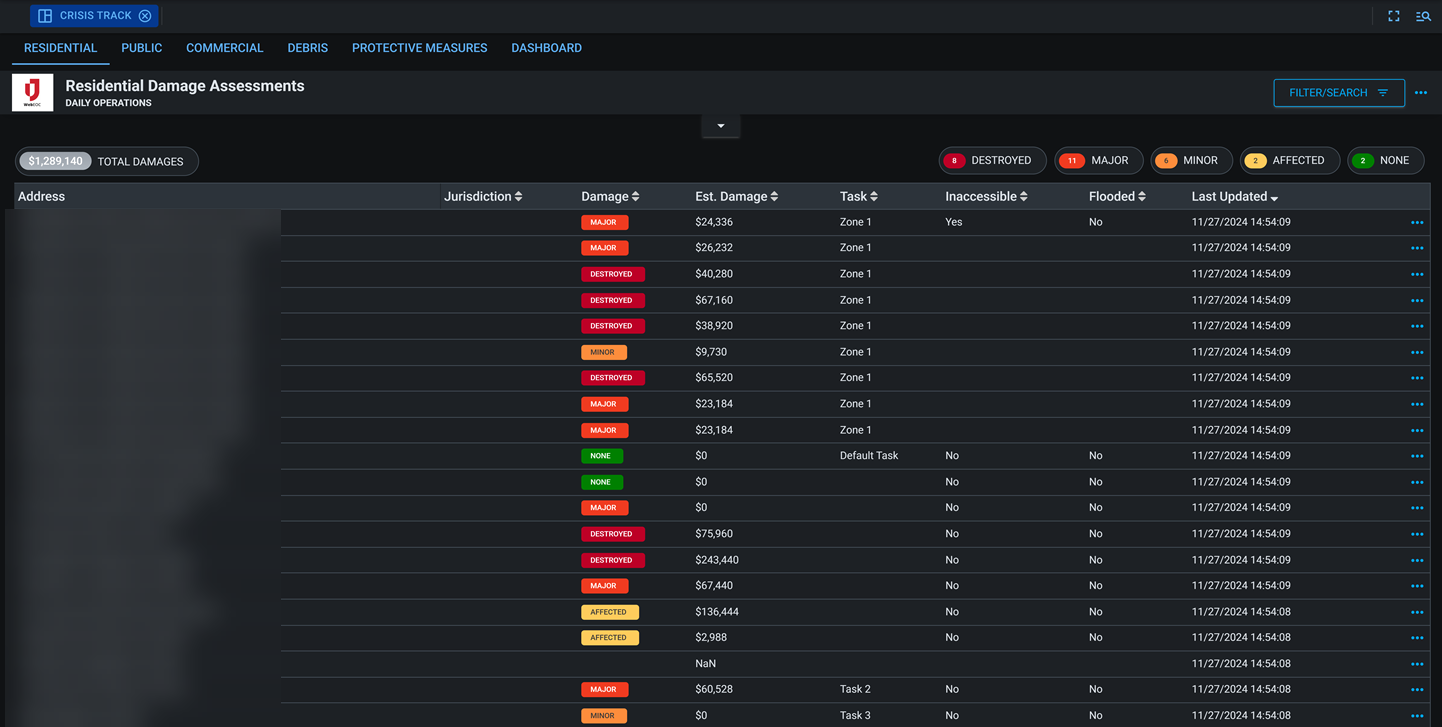
- Visualize assessments: Display residential, commercial, public, debris, and protective measure assessments in WebEOC Nexus.
-
Validate data: Review and confirm submitted assessments for completeness and accuracy.
-
Set damage thresholds: Set the damage threshold amount, a dollar amount in damages that must be met before a disaster can be officially declared.
-
Review findings: Review submitted records and dashboard visualizations for leadership and team member awareness.
-
Export data: Generate formatted reports for recordkeeping and assistance requests.

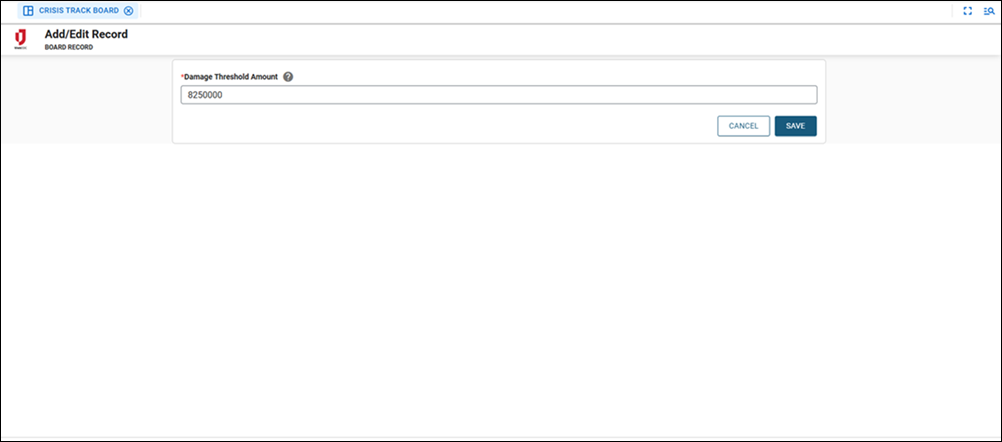
Set Damage Threshold Amount
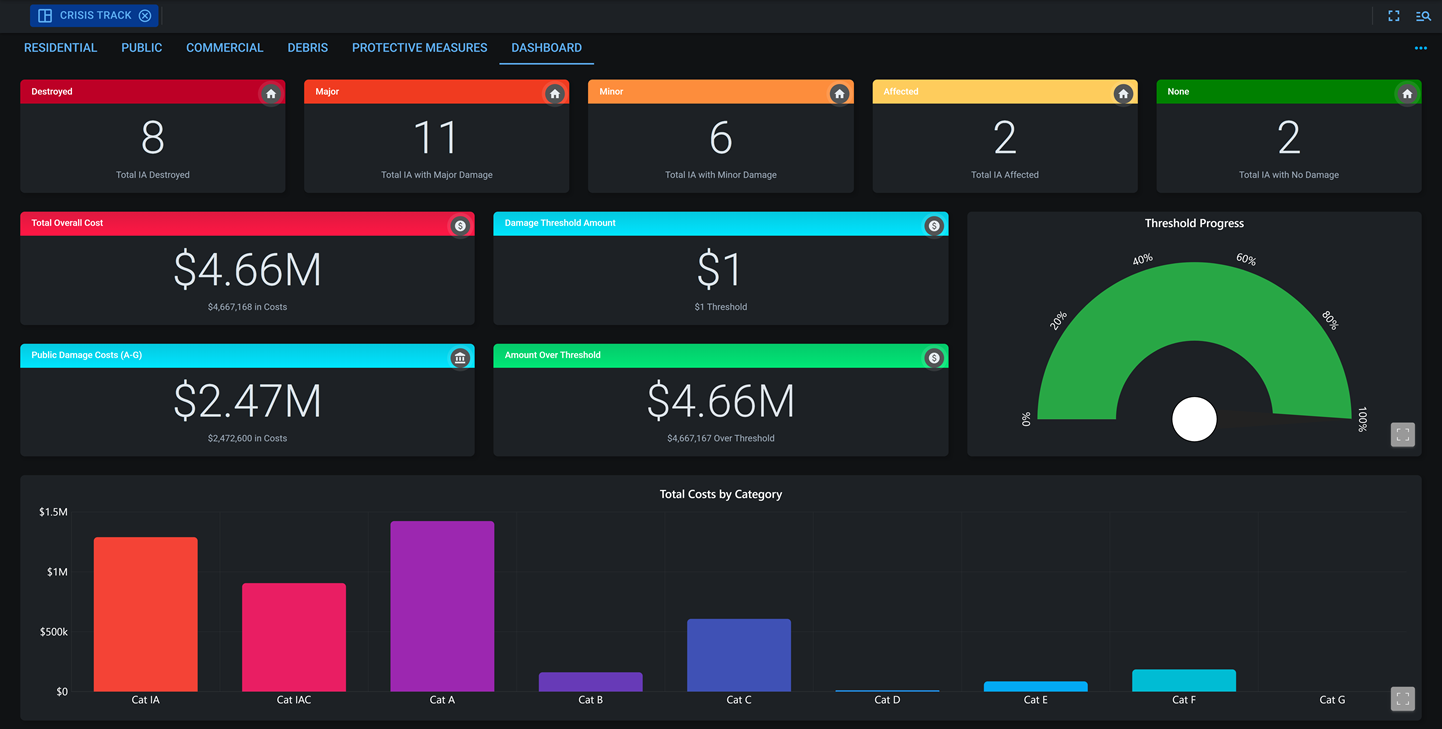
You can add a damage threshold amount, a dollar amount in damages that must be met before a disaster can be officially declared. The dashboard will display the threshold amount, the amount remaining before reaching the threshold, and a graphical representation of those numbers.
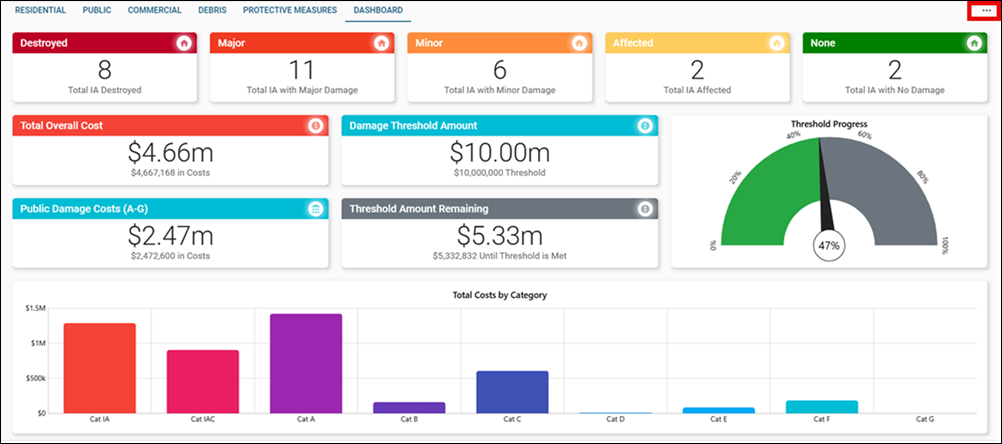
You can set the damage threshold amount by clicking the more icon ![]() at the top right of the dashboard.
at the top right of the dashboard.
This board includes Comments and Share buttons, which can be enabled if you are using WebEOC Nexus 10.18 and later and version 1.3.2 and later of this board. For these buttons to display, use the Board Permission Tags Board Comments and Board Links Sharing when assigning feature groups access to the board. See Board Comments and Share Board Links for details about these features.
This board has dark mode capability.
Dark mode must be enabled for your instance so that users can turn it on. See Enable Dark Mode for details.
Related Concepts
Crisis Track Integration Release Notes
Related Tasks