View Damage Assessment Charts
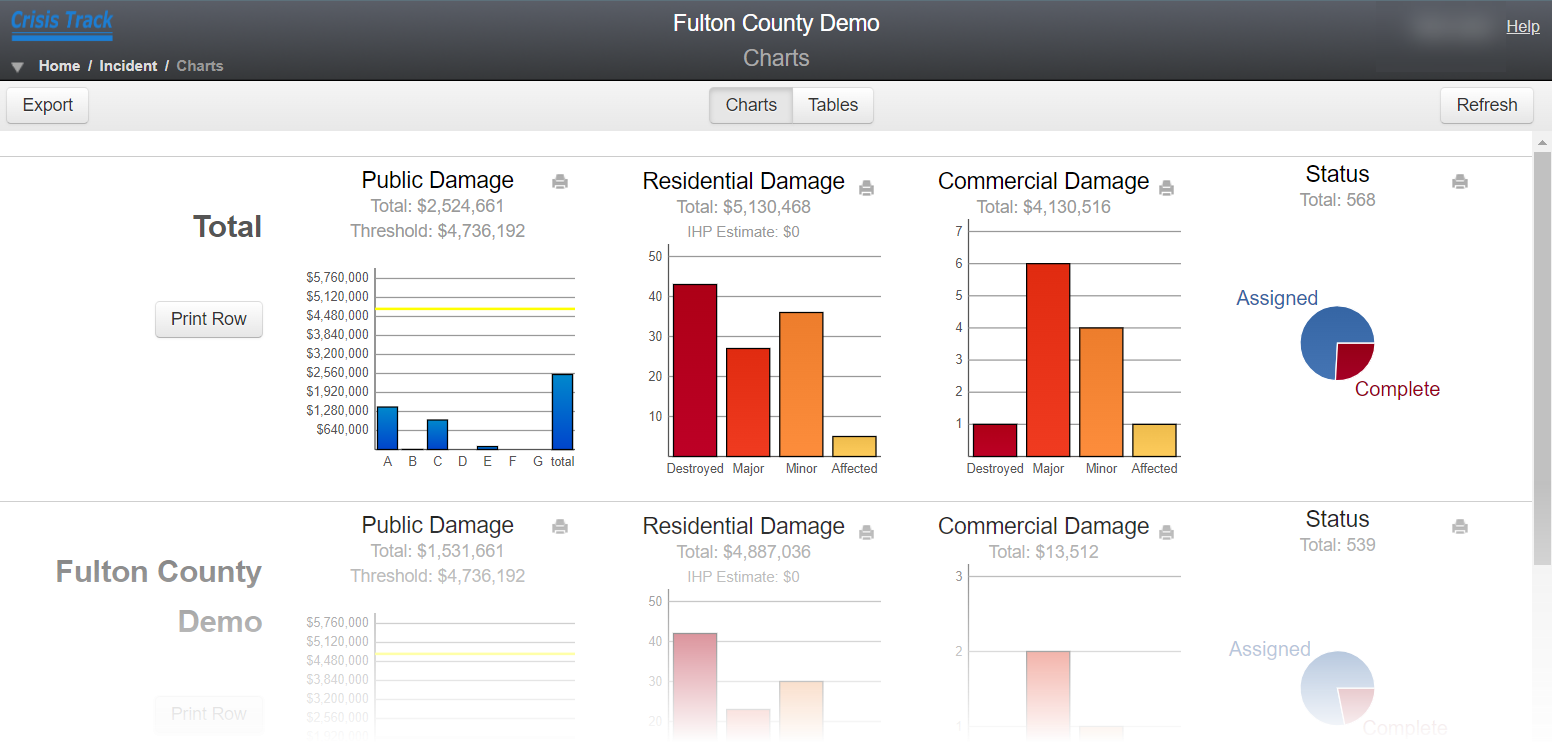
The Charts page of the Charts module summarizes damage assessment data by type in several charts. The first row of charts displays data from all entries for the selected incident. If you have jurisdictions set up, this page also displays a row of charts for each jurisdiction.

This page displays the following charts.
| Chart | Description |
|---|---|
|
Public Damage |
Damage costs for public infrastructure sorted by FEMA's Public Assistance categories. For more information, see FEMA's documentation on their website. The yellow line on the chart represents the threshold, which helps predict if the state or county is eligible for public assistance. If the total public damage for the state or county is below the threshold, then it is likely ineligible for public assistance. The threshold is calculated based on FEMA's Per Capita Impact Indicators. For example, to calculate the threshold for a county, Crisis Track multiplies the current Countywide Impact Indicator by the population of the county. Administrators can edit the population in the Settings module. |
|
Residential Damage |
Number of damaged residential properties, sorted by the severity of damage. The total damage cost for residential properties is also displayed. The IHP Estimate estimates the amount of assistance granted from FEMA's Individuals and Households Program based on the number of residential properties in the Destroyed or Major damage categories. For more information about the Individuals and Households Program, see FEMA's documentation on their website. |
|
Commercial Damage |
Number of damaged commercial properties, sorted by the severity of damage. The total damage cost for commercial properties is also displayed. |
|
Status |
Number of entries, sorted by completeness. |