Dashboard Widgets
Widgets are components added to dashboards to organize, analyze, and present information about resources and status types. Widgets display as tables, graphs, or summaries, and they have specific themes that define the type of displayed data. For example, the Event widget displays active events by region.
When creating widgets, you may have to identify a resource group or resource types, status type, and other options that determine what information is displayed.
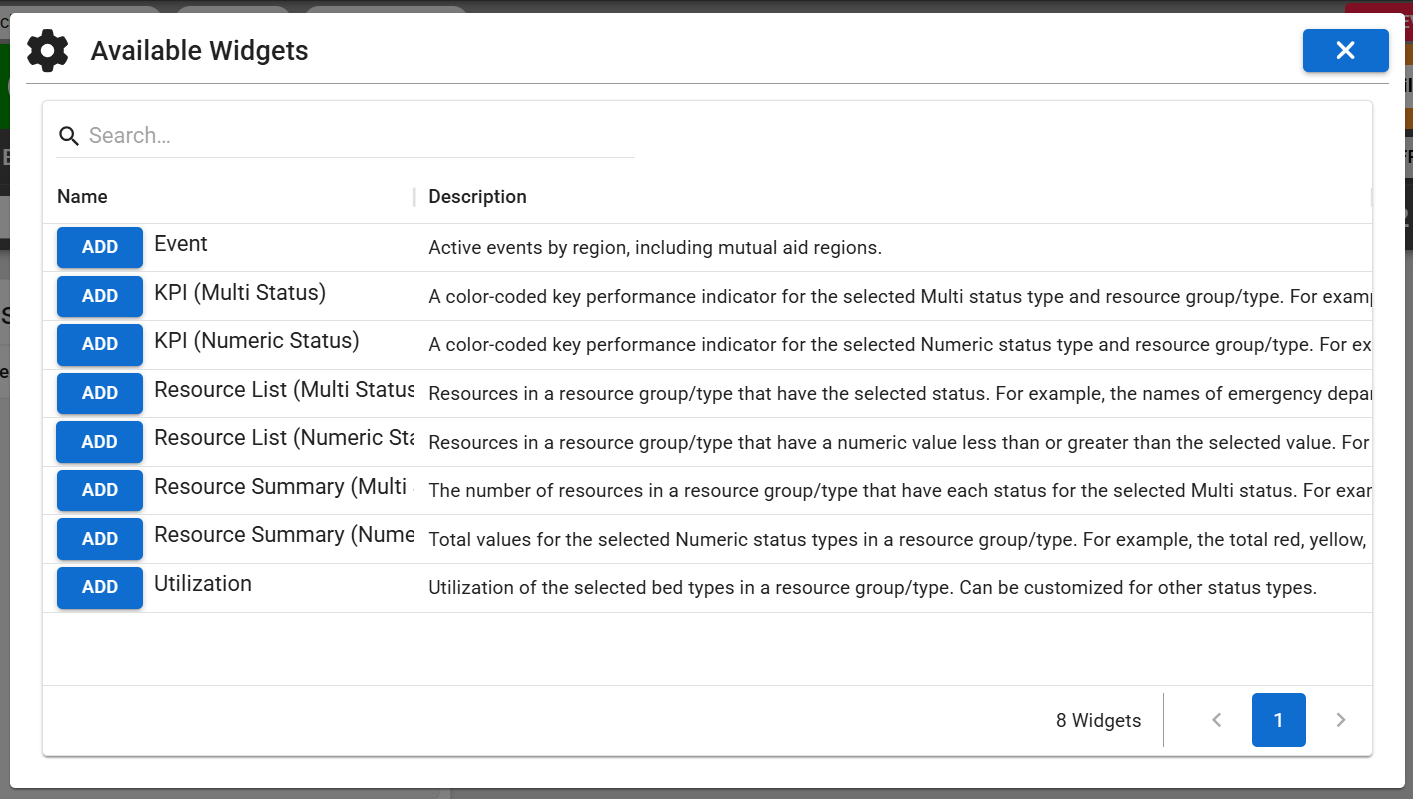
A list of available widgets appears when you click Add Widget on a dashboard.
The following widgets are available:
|
Widget |
Description |
|---|---|
|
Active events by region, including mutual aid regions. |
|
|
A color-coded key performance indicator for the selected Multi status type and resource group/type. For example, the number of emergency departments on diversion in the state. |
|
|
A color-coded key performance indicator for the selected Numeric status type and resource group/type. For example, the total number of available beds in the region. |
|
|
Resources in a resource group/type that have the selected status. For example, the names of emergency departments on diversion in a catchment area. |
|
|
Resources in a resource group/type that have a numeric value less than or greater than the selected value. For example, hospitals in a FEMA region with one or more available burn beds. |
|
|
The number of resources in a resource group/type that have each status for the selected Multi status. For example, the number of aeromedical units in the state that are available, transporting patients, or unavailable. |
|
|
Total values for the selected Numeric status types in a resource group/type. For example, the total red, yellow, and green triage patients for all hospitals in a metro area. |
|
|
Utilization of the selected bed types in a resource group/type. Can be customized for other status types. |
