The Incident Dashboard is a central location through which people involved in an incident can access information. During response, command staff and responders use it to review their objectives, communicate with one another, view incident locations, and more. After an incident ends, facility administrators and staff use the dashboard to review incident details, develop the after action report A report that documents incident outcomes, lessons learned, and improvement opportunities., and make improvements to the plan.
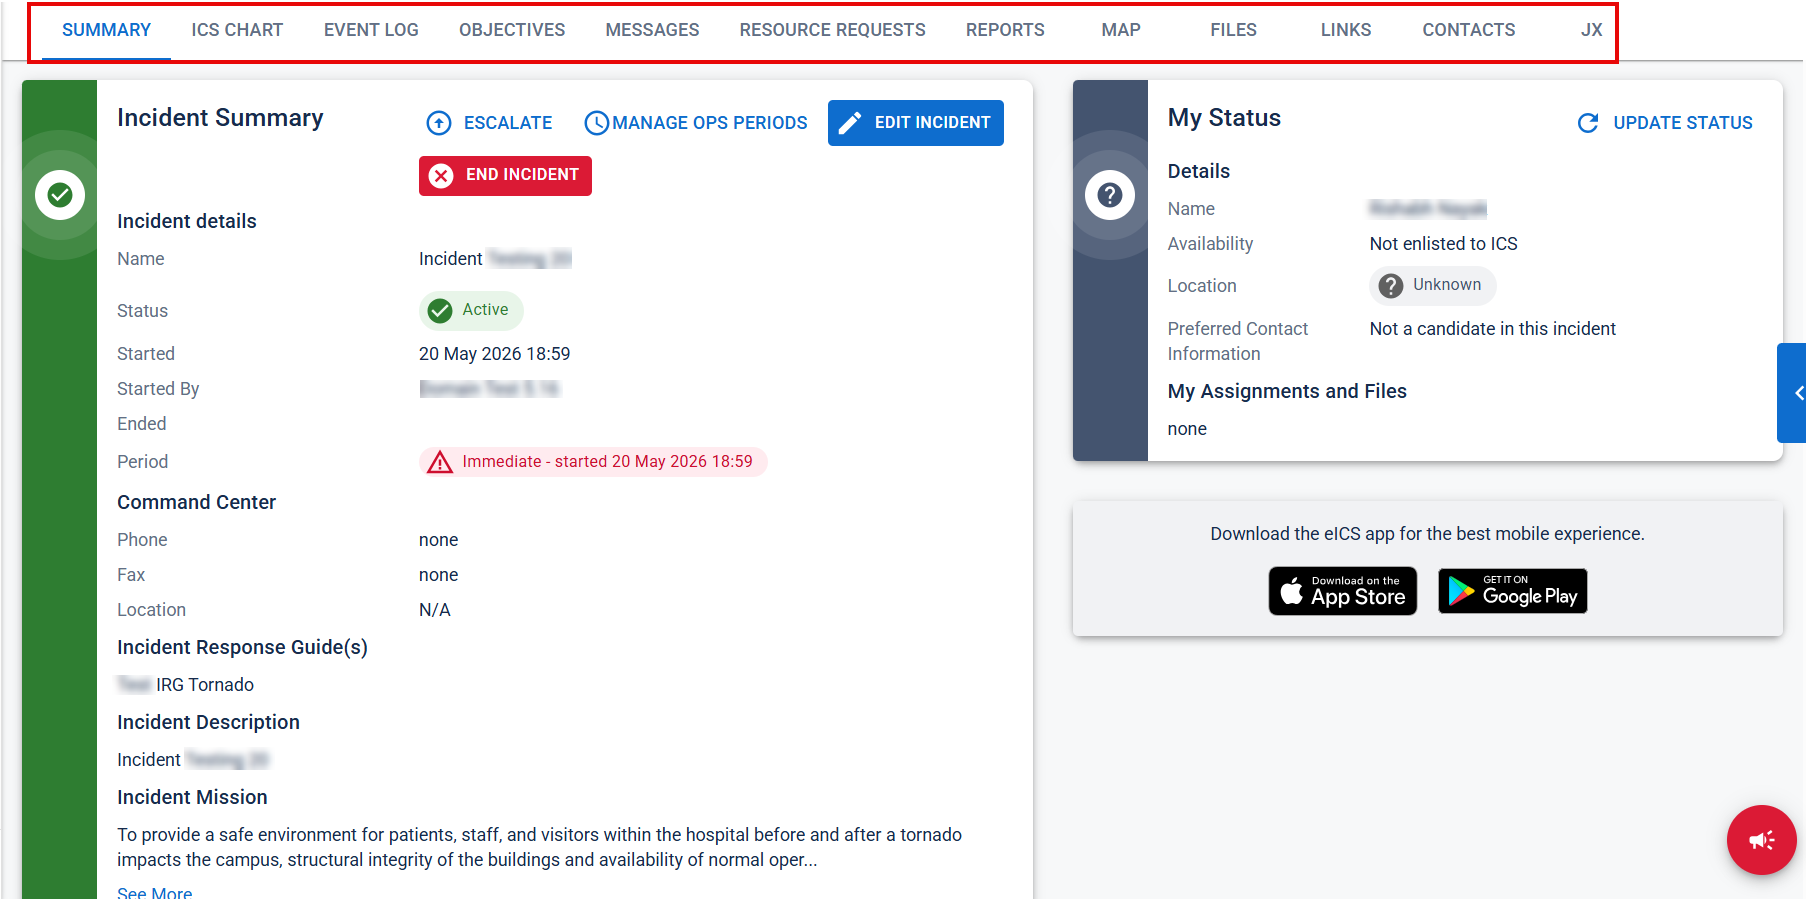
Press F5 to refresh information on the Incident Dashboard without reloading the entire application.
To access the Incident Dashboard
-
In the main menu, select Response. The Response page opens.
-
Select the Incidents tab.
-
For Incidents for, select the correct facility.
-
Locate the incident you want to view. On that row, click View. The Incident Dashboard opens to the Summary tab.
Tabs
The tabs at the top of the page provide access to crucial information that incident commanders and command staff manage during incidents. Depending on your solution configurations, the following tabs may appear on the Incident Dashboard:
-
Summary
-
ICS Chart
-
Event Log
-
Files
-
Objectives
-
Messages
-
Contacts
-
Documents
-
Map
-
Custom (usually named to reflect the content on the tab)
-
Improvement Plan (available after the incident has ended)
Incident Switcher
The Incident Switcher drop-down provides quick navigation between active incidents. It displays up to ten of the most recent real or exercise A simulated incident used to train personnel and evaluate emergency plans. events (excluding system tests A non-production incident used to verify system functionality or configuration.) and keeps the current browser tab open when switching.

Recent Events
The Recent Events panel provides quick access to the latest activity associated with an incident. Recent events may include notifications An alert, update, advisory, information, drill, or test message that can be sent & received through delivery methods such as email, voice, text, fax, or inbox., position updates, log comments, incident updates, and other incident-related activities.

Events that have been assigned a Highpriority are color coded pink or red to draw special attention to them. eICS emits an audible alert An alert, update, advisory, information, drill, or test message that can be sent & received through delivery methods such as email, voice, text, fax, or inbox. when this type of event is added to the ticker.
To view recent events, select the Recent Events button on the right side of the Incident Dashboard. A slide-out panel opens and displays the most recent incident activity.
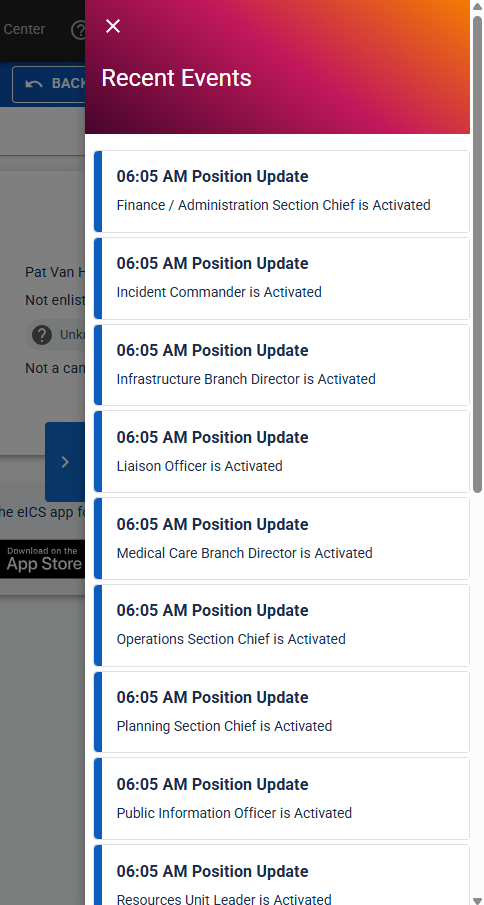
Each event entry includes:
-
The time the event occurred
-
The event type
-
Event details
The Recent Events panel can be opened and closed at any time while working within the Incident Dashboard, allowing you to review recent activity without navigating away from your current page.
Links
From any tab in the Incident Dashboard, you can use the links near the top of the dashboard to:
-
Disable Notifications
-
Access the After Action Report
-
Print a form
-
Send a message
-
Add an entry to the Event Log
You can also perform these last two actions from the Messages and Event Log tabs, respectively.
Improvement Plan
The Improvement Plan tab appears in the Incident Dashboard when the incident has ended. It shows improvement items (log entries) marked during the incident and added after (log entries, objectives, and messages). This allows you to direct your efforts to improve the planning and response for this type of incident.
From this tab, you can add another improvement item, edit existing issues, or work with action items.
Versions
Although the dashboard looks the same, in reality, there are two distinct versions: the general incident dashboard and the position-specific dashboard. The user and situation dictate which version opens when you initially access the incident.
If you just created the incident, you see the incident-level dashboard, which provides access to information across all positions. When you are associated with or assigned to one ICS position, the position-level version opens. The primary difference in the position dashboard is that certain tabs show information for that position by default.
Example If you are assigned the Public Information Officer position and open the Incident Dashboard, on the Objectives, tab you can see the objectives that are tied to your position. The Assignment field in the upper left of the tab lets you change this view.