Create Dashboards
You can perform this task if you are a WebEOC Full Admin or belong to JX User Groups with Dashboard Builder permission enabled.
A Dashboard is a collection of visuals from one or more data sources. You can create a dashboard with a single visual and add additional visuals as needed. WebEOC Nexus’s self-serve report builder enables quick build, edit, filter setup, reposition, resize, and sharing options.
After you have successfully connected to your data stores and configured your data sources, you can immediately start exploring and interacting with the data using dashboards and dashboard visuals.
If you have the correct permissions, you can create a dashboard. You must have permission to the visuals and sources on which the dashboard is based. To view a dashboard, you must have Read permissions set for the visuals on the dashboard and the dashboard itself.
To create a dashboard from a new visual
-
Identify the data you need to use from your data stores to perform the data analytics for the dashboard.
-
Define data source configurations that collect the data you need. Data source configurations use the data store connections previously defined.
-
Optionally, configure row and column security for your data sources.
-
Optionally, configure permissions for each data source.
-
In the main menu, click Juvare Analyze. The Dashboards page opens.
-
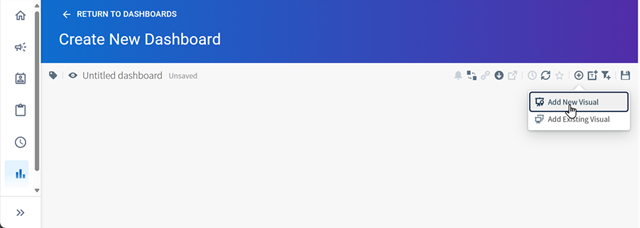
Click Create Dashboard. The Create New Dashboard page opens.
-
Click the Add New Visual icon.
-
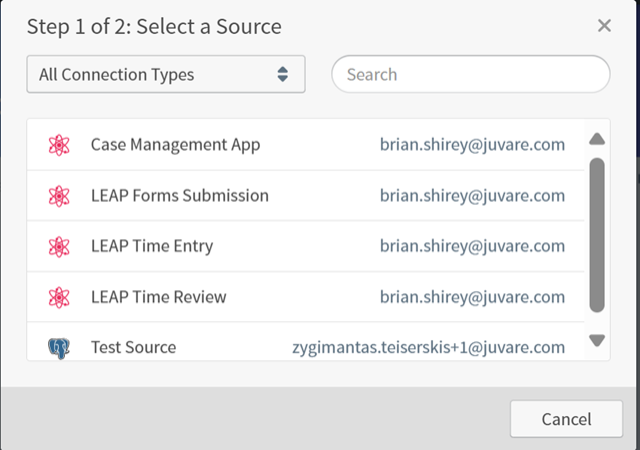
Select a source for the visual.
-
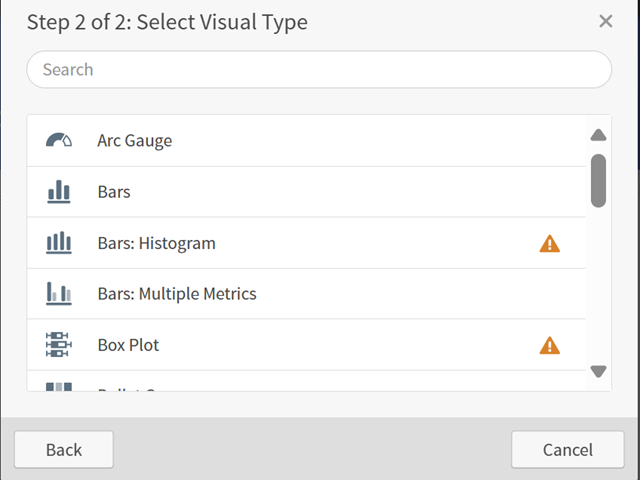
Select a visual type,
-
Enter a name for the dashboard in the top left.
-
As needed, configure the dashboard with filters, interactivity, and links to other dashboards.
-
Save the dashboard.
To create a dashboard from an existing visual
-
Follow steps 1 - 6 above.
-
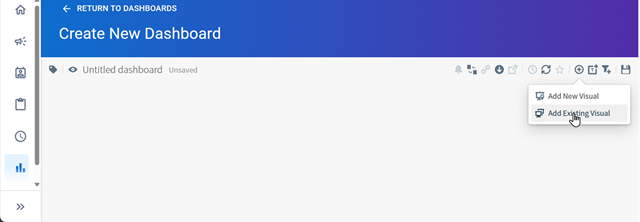
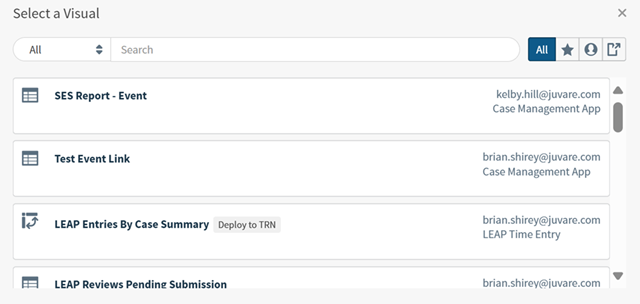
Select Add Existing Visual.
-
Select a visual.
-
Enter a name for the dashboard in the top left.
-
As needed, configure the dashboard with filters, interactivity, and links to other dashboards.
-
Save the dashboard.
To set permissions for the dashboard
-
On the Dashboards page, click the Permissions icon for the newly created dashboard.
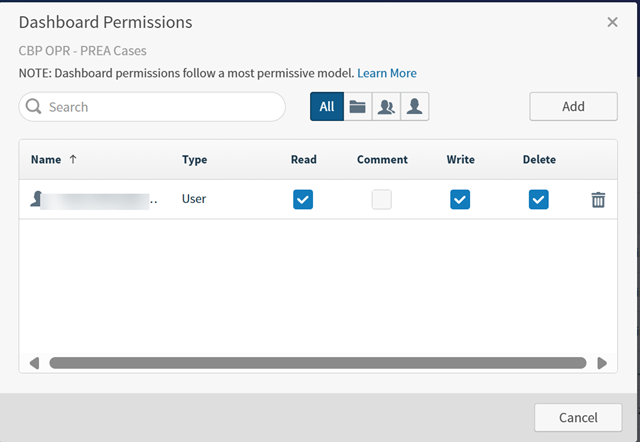
As the dashboard creator, you have read, write, and delete permission by default.
The icons to the right of the Search box can be used to filter search results by All, tenant (which is your instance), groups, and users.
-
Select the Read, Comment, Write, or Delete checkbox for all groups or users that should be able to view, comment on, edit or delete the dashboard.
-
Click Save.
For more information about dashboards, see: