Create Visuals
A visual is the element used to visualize and explore data and can be a graph, chart, table or other format. Juvare Analyze offers a wide array of different visual styles and tools for analyzing and exploring data. Visuals use data from your data sources to present information in a layout that is easy to view, adjust, and update. You can create visuals that are used in multiple dashboards, stored and shared in the Visual Gallery, or local visuals unique to a single dashboard.
-
You can create visuals if you are a WebEOC Full Admin or belong to JX User Groups with Dashboard Builder permission enabled.
-
If you are a WebEOC Full Admin or belong to JX User Groups with Dashboard Builder permission enabled, you must have Read permission to the source upon which the visual will be created.
Users must also have Read permissions to view data in the visual on a dashboard.
Visuals saved in the visual gallery can be used across multiple dashboards. Changes to visuals in the visual gallery will be reflected on all dashboards.
Visuals display on the Select a Visual dialog when a user creating a dashboard selects Create Dashboard > Add Existing Visual.
To create a visual
-
In the main menu, click Juvare Analyze. The Dashboards page opens.
-
Click the Visuals tab.
-
Select Create Visual.
-
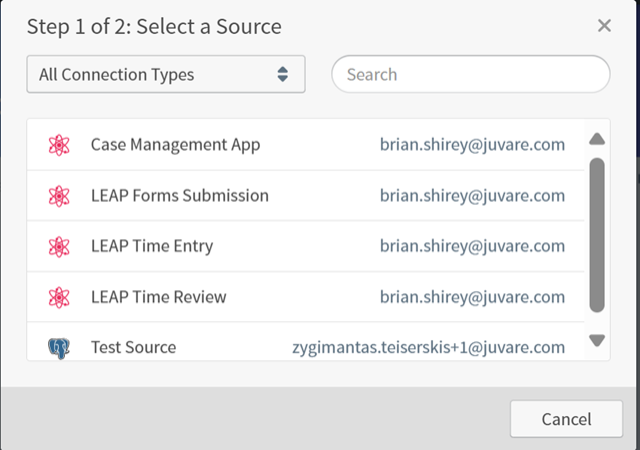
Select a source for the visual.
-
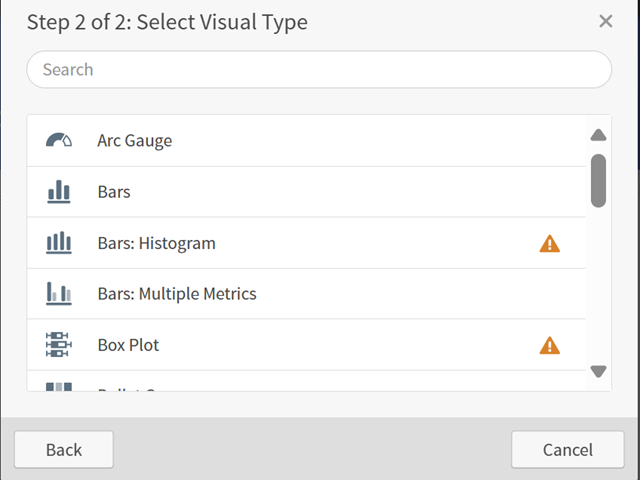
Select the Visual Type.
-
Name the visual with a business-relevant title so that other users can understand the data displayed when searching in the visual gallery.
-
Click Save.
-
On the Visuals page, click the Permissions icon for the newly created visual.
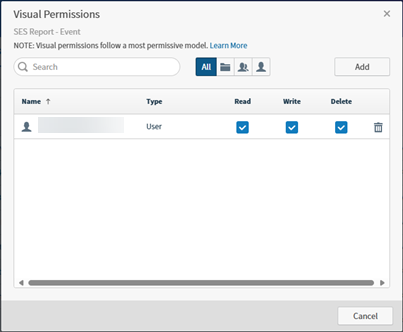
As the creator of the visual, you have read, write and delete permission by default.
The icons to the right of the Search box can be used to filter search results by All, tenant (which is your instance), groups, and users.
-
Click the Read, Write, or Delete checkbox for all groups or users that should be able to view, edit, or delete the visual on a dashboard.
-
Click Save.
You cannot delete a visual that is in use by a dashboard.
For more information about visuals, see: