View Data On a Timeline on Maps
The Time Slider is an Esri ArcGIS widget integrated with WebEOC Nexus that displays data from board layers and external data layers over distinct points on a timeline.
Watch a video about this feature.
Once enabled on a map, the Time Slider widget displays time data spanning from the earliest date to the latest date of all data in all layers used in the map. Even if a layer is hidden, the start and end times on that layer are reflected in how the Time Slider calculates its overall start and end date. For example, if a map has three layers, one with 72 hours of weather data, one with 48 hours of wildfire data, and one with 24 hours of flood data, if the layer with 72 hours of weather data is hidden on the map, the Time Slider will still show data spanning the 72 hour time.
If new time data that goes beyond the earliest or latest date is added to a map layer, the Time Slider updates to include that information.
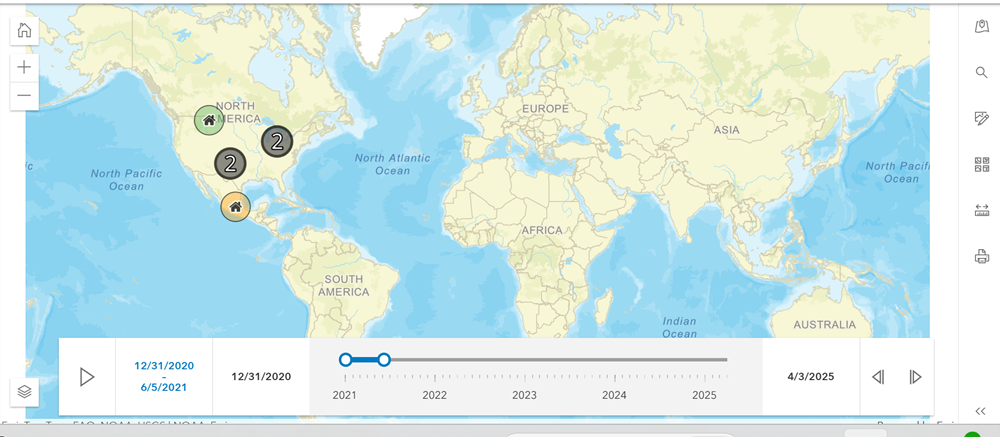
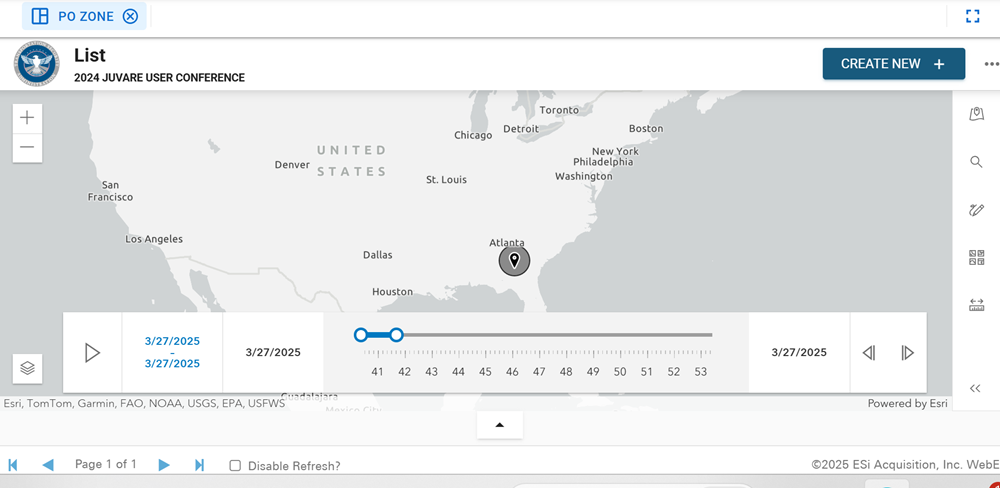
By default, the timeline is broken into ten equal increments, and each stop on the slider represents one moment in time. The interval is indicated beneath each point by either the name of the year, the name of the month, the name of the day of the week, and so on. If only numbers display beneath each data point, the value is in minutes, which would represent a timeline of records from the same hour.
Be aware of how the time entries in board records may affect the overall timeline of the Time Slider. If an incident-independent board has a single record from three years ago, for example, that is where the Time Slider will begin displaying data, even if the next record on the board is much closer to the current day. The equally spaced intervals on the Time Slider will use this expanded overall timeline, which will then display data points which may be difficult to interpret.
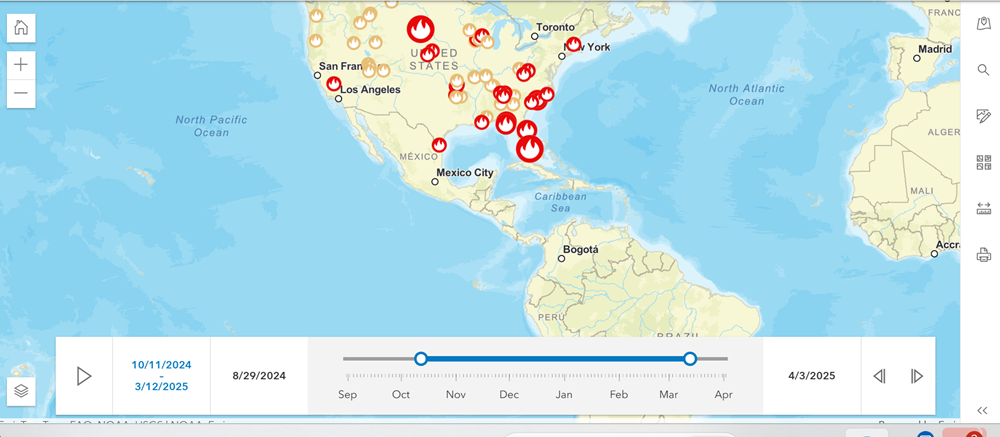
While viewing data using the Time Slider, you can select the segment length to use as you play through the data on the map. By default, at its shortest, the segment will move through each of the ten points. Move the start and end points away from each other to expand the segment. This allows you to view fewer points in time as the data plays.
Here, the slider segment has been extended to show fewer data points when you play the timeline.
Here, the Time Slider displays on a map on a board.
Display the Time Slider Widget
By default, the Time Slider is not displayed on maps. It must be enabled.
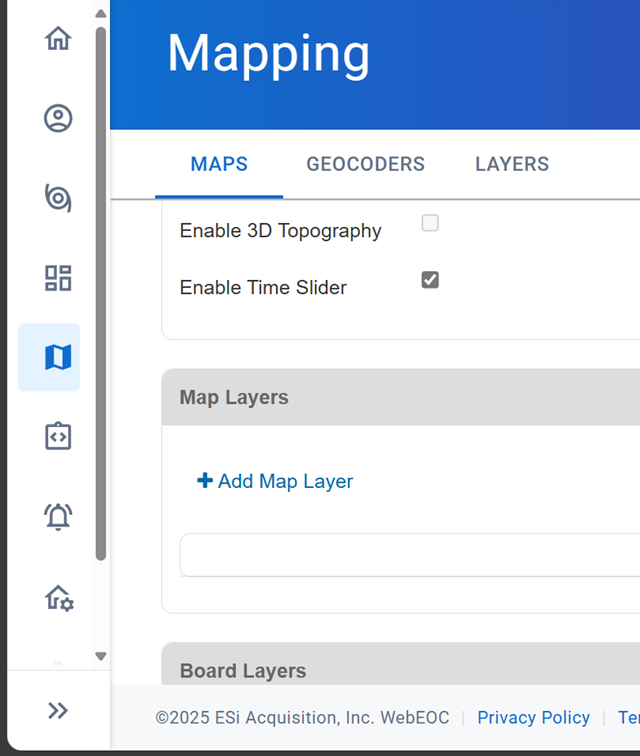
To display the Time Slider on a map
-
In the main menu, click the mapping icon
 . The Mapping page opens.
 -
On the Maps tab, click the name of the map to add the Time Slider to.
-
At the bottom of the Details section, click the Enable Time Slider checkbox to select it.
To configure the Time Slider to display on a board
-
The Time Slider widget must be enabled on the map used in the board.
-
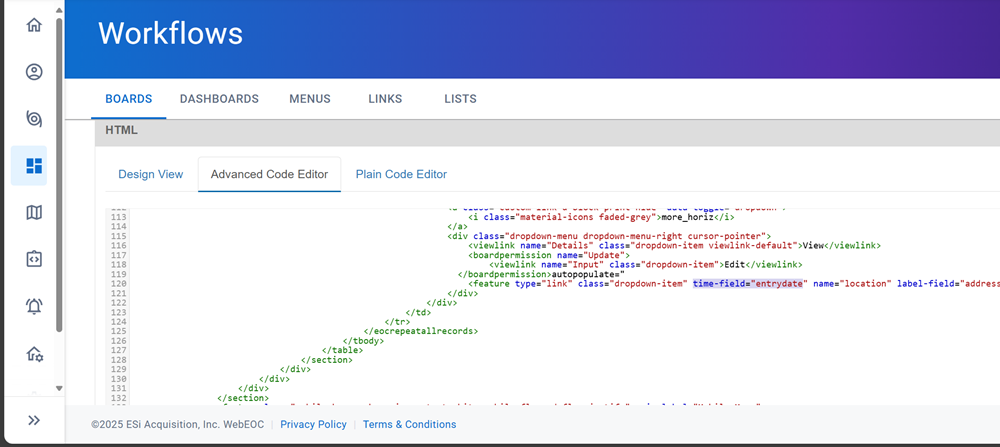
The board where the map displays must have the time-field attribute added to the <feature> tag and this attribute must be tied to a time-related field on the board (for example, Entry Date). If you do not assign the time-field attribute to a time field, the Time Slider will not work. For information about using the time-field attribute on the <feature> tag, see <feature>.
-
If the board uses an embedded map, the enableheader="true" attribute must be set for the Time Slider to display on the embedded map. See <embedmap> and Embed a Map in a Board for details.
If you export the map to PDF, the Time Slider data is included.
When viewing the Time Slider, you can play through the timeline by clicking the play button on the bottom left. You can move through each segment on the timeline using the Previous and Next buttons in the bottom right.
Related Concepts
Related Tasks
